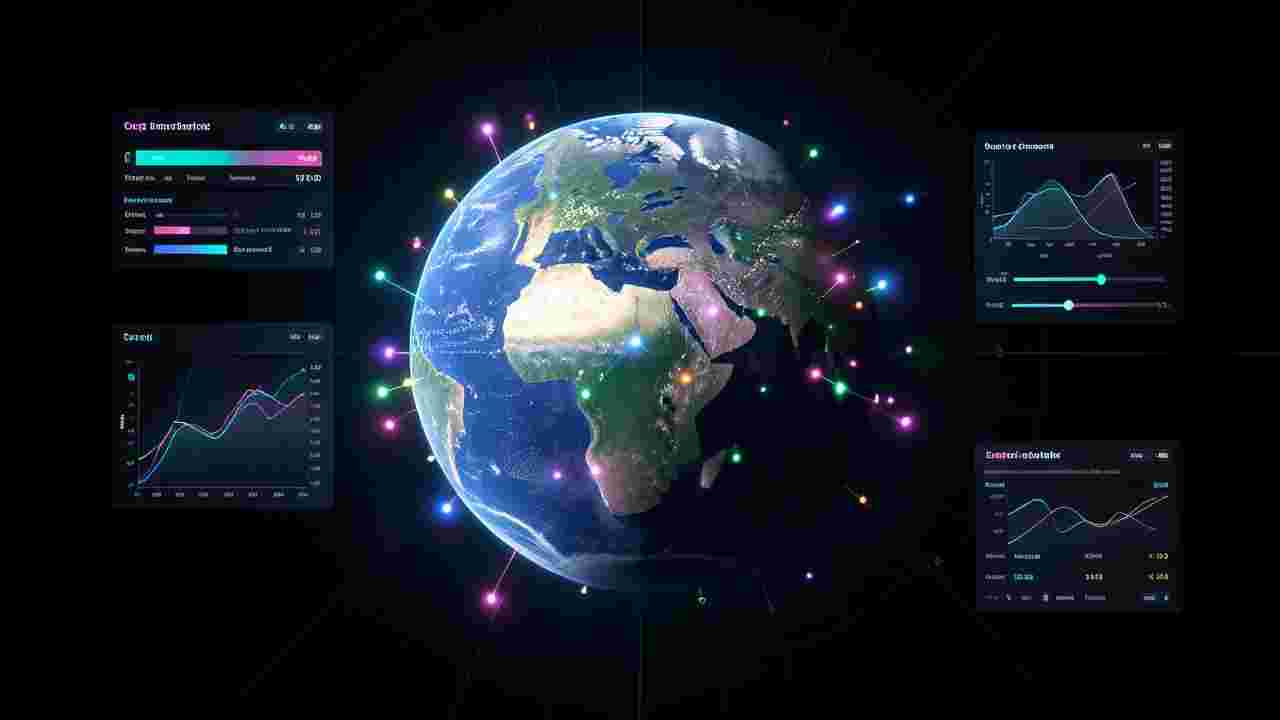
Introduction to Serverless 3D Globe Visualizations
Visualizing real-time data on interactive 3D globes has traditionally required backend infrastructure to process and serve data dynamically. However, modern frontend technologies like WebGL, Three.js, and D3.js now enable developers to create immersive, serverless visualizations entirely in the browser. This approach eliminates server costs, reduces latency, and allows for instant deployment. By leveraging client-side parsing of live data feeds—such as USGS earthquake data—you can build dynamic 3D globes that update in real time without relying on a server. In this guide, we’ll explore how to transform raw GeoJSON data into an interactive 3D sphere visualization, encode meaningful metrics through color gradients and size variations, and ensure seamless interactivity even when offline.
Why Use a Serverless Approach for 3D Globe Visualizations?
- Cost Efficiency: No need for server hosting or backend services reduces operational expenses significantly.
- Instant Deployment: Updates are immediate as data is fetched and processed client-side.
- Scalability: Client-side rendering handles thousands of data points without backend load balancing.
- Offline Functionality: Data can be cached locally, allowing visualizations to work without an internet connection.
- Improved Performance: Eliminates network latency between server and client for faster rendering.
- Simplified Architecture: No server-side dependencies mean fewer components to maintain or secure.
Tools and Libraries You Need
- Three.js: A powerful 3D graphics library for rendering interactive spheres and globes in the browser.
- D3.js: Helps parse and manipulate GeoJSON data, and provides utilities for data transformations.
- Turf.js: A geospatial analysis library ideal for coordinate calculations and transformations.
- Axios or Fetch API: For making HTTP requests to fetch real-time data streams.
- LocalForage: For caching data locally to support offline functionality.
- Web Workers: To offload data processing from the main thread and improve performance.
Step 1: Fetch and Parse Real-Time Data Streams
Start by selecting a real-time data source. For this example, we’ll use the USGS earthquake feed, which provides GeoJSON data containing earthquake events worldwide. The endpoint for this feed is typically available at api.usgs.gov. Use the Fetch API or Axios to retrieve the data. Since the feed updates frequently, implement a polling mechanism using setInterval or a Web Worker to fetch new data every few seconds. Once the data is retrieved, parse the JSON response and normalize the structure to extract key fields like latitude, longitude, magnitude, and timestamp. Use Turf.js to validate and transform coordinates into the correct format for rendering.
fetch('https://earthquake.usgs.gov/earthquakes/feed/v1.0/summary/all_hour.geojson')

  .then(response => response.json())

  .then(data => {

    const earthquakes = data.features.map(feature => ({

      lat: feature.geometry.coordinates[1],

      lng: feature.geometry.coordinates[0],

      magnitude: feature.properties.mag,

      time: new Date(feature.properties.time),

      depth: feature.geometry.coordinates[2]

    }));

  });
Step 2: Set Up the 3D Globe Using Three.js
Initialize a Three.js scene with a camera, renderer, and controls to enable user interaction like zooming and rotating. Create a sphere geometry representing the Earth, and apply a high-resolution texture map to give it a realistic appearance. Use a standard material for the globe and add ambient and directional lighting to enhance depth and realism. Position the camera at a vantage point that provides a clear view of the entire globe. Add event listeners to the camera and controls to respond to user inputs such as mouse drags or scroll wheel zooms.
const scene = new THREE.Scene();

const camera = new THREE.PerspectiveCamera(75, window.innerWidth / window.innerHeight, 0.1, 1000);

const renderer = new THREE.WebGLRenderer({ antialias: true });

renderer.setSize(window.innerWidth, window.innerHeight);

document.body.appendChild(renderer.domElement);
const earthGeometry = new THREE.SphereGeometry(5, 64, 64);
const earthMaterial = new THREE.MeshPhongMaterial({
map: new THREE.TextureLoader().load('path/to/earth-texture.jpg'),
bumpMap: new THREE.TextureLoader().load('path/to/earth-bump.jpg'),
bumpScale: 0.05
});
const earth = new THREE.Mesh(earthGeometry, earthMaterial);
scene.add(earth);
camera.position.z = 10;
const controls = new THREE.OrbitControls(camera, renderer.domElement);
Step 3: Map Coordinates to 3D Points on the Globe
Convert latitude and longitude coordinates from your data feed into 3D Cartesian coordinates that Three.js can render on the sphere’s surface. This involves converting spherical coordinates (latitude, longitude) to Cartesian (x, y, z) using trigonometric functions. The radius of the sphere determines the scale, and the conversion must account for the Earth’s radius. Use a helper function to map each data point to a position on the globe. Adjust the scale of the markers based on the magnitude of the event to visually emphasize significant occurrences.
function latLngToVector3(lat, lng, radius) {

  const phi = (90 - lat) * (Math.PI / 180);

  const theta = (lng + 180) * (Math.PI / 180);
const x = -radius * Math.sin(phi) * Math.cos(theta);
const z = radius * Math.sin(phi) * Math.sin(theta);
const y = radius * Math.cos(phi);
return new THREE.Vector3(x, y, z);
}
const points = earthquakes.map(quake => {
const position = latLngToVector3(quake.lat, quake.lng, 5);
return {
position,
magnitude: quake.magnitude,
depth: quake.depth
};
});
Step 4: Encode Metrics with Visual Cues
Visual encoding transforms raw data into meaningful insights. Use color gradients to represent depth or magnitude, with warmer colors for higher values. Scale the size of markers proportionally to the magnitude, making powerful earthquakes appear larger. Add tooltips or popups that display detailed information when users hover over markers. These cues help users quickly assess the significance and location of events. Use D3.js scales to map data values to visual properties like color and size dynamically.
const colorScale = d3.scaleSequential(d3.interpolateViridis)

  .domain([0, 10]);
points.forEach(point => {
const color = colorScale(point.magnitude);
const size = point.magnitude * 0.5;
const markerGeometry = new THREE.SphereGeometry(size, 16, 16);
const markerMaterial = new THREE.MeshBasicMaterial({ color });
const marker = new THREE.Mesh(markerGeometry, markerMaterial);
marker.position.copy(point.position);
scene.add(marker);
});
Step 5: Implement Real-Time Updates and Animation
To visualize real-time data, continuously update the scene with new data points. Use requestAnimationFrame to animate the globe and markers smoothly. Apply a fade-in effect for new markers to highlight recent events. Remove outdated markers after a specified duration to prevent clutter. Implement a Web Worker to handle data fetching and processing off the main thread, ensuring the UI remains responsive. Use a setInterval or setTimeout loop to periodically fetch new data without blocking the main thread.
let lastUpdateTime = 0;

const updateInterval = 5000; // 5 seconds
function animate() {
requestAnimationFrame(animate);
controls.update();
const now = Date.now();
if (now - lastUpdateTime > updateInterval) {
fetchEarthquakeData();
lastUpdateTime = now;
}
renderer.render(scene, camera);
}
async function fetchEarthquakeData() {
const response = await fetch('https://earthquake.usgs.gov/earthquakes/feed/v1.0/summary/all_hour.geojson');
const data = await response.json();
updateMarkers(data.features);
}
async function updateMarkers(features) {
// Clear old markers
scene.children = scene.children.filter(child => child.userData.isMarker === false);
// Add new markers
features.forEach(feature => {
const quake = {
lat: feature.geometry.coordinates[1],
lng: feature.geometry.coordinates[0],
magnitude: feature.properties.mag,
time: new Date(feature.properties.time)
};
const position = latLngToVector3(quake.lat, quake.lng, 5);
const size = quake.magnitude * 0.5;
const color = colorScale(quake.magnitude);
const markerGeometry = new THREE.SphereGeometry(size, 16, 16);
const markerMaterial = new THREE.MeshBasicMaterial({ color });
const marker = new THREE.Mesh(markerGeometry, markerMaterial);
marker.position.copy(position);
marker.userData = { isMarker: true };
scene.add(marker);
});
}
Step 6: Enable Offline Caching and Data Persistence
Support offline functionality by caching fetched data and rendered markers locally. Use LocalForage or IndexedDB to store the GeoJSON data and marker configurations. When the user revisits the page or goes offline, load cached data instead of making a network request. Implement a fallback UI that notifies users when they are offline and offers to load cached data. Additionally, cache the Earth texture and other static assets to ensure the globe renders correctly even without an internet connection.
// Using LocalForage for caching

localforage.setItem('earthquakeData', data.features);
localforage.getItem('earthquakeData').then(data => {
if (data) {
updateMarkers(data);
}
});
Step 7: Optimize Performance and User Experience
Performance is critical for real-time 3D visualizations. Implement techniques like frustum culling to avoid rendering markers that are not visible. Limit the number of markers displayed simultaneously by filtering based on recency or magnitude. Use instanced rendering for markers to reduce the number of draw calls. Optimize textures and geometries to minimize memory usage. Provide user controls for adjusting the refresh rate, toggling data layers, or filtering events by type or region. Ensure the visualization remains responsive even on lower-end devices.
Advanced Customizations and Extensions
- Add time sliders to allow users to view historical data or replay events over time.
- Incorporate additional data layers such as tectonic plates, fault lines, or ocean currents.
- Implement clustering for markers to reduce visual clutter when multiple events occur in close proximity.
- Use shaders to create dynamic lighting effects that respond to user interactions or data changes.
- Integrate with other APIs like NOAA for weather data or NASA for satellite imagery to enrich the visualization.
- Add voice commands or gesture controls for accessibility and enhanced interactivity.
- Deploy the visualization as a progressive web app (PWA) for offline use and easy installation.
Testing and Debugging Tips
- Use browser developer tools to monitor memory usage and performance with the Performance tab.
- Test on multiple devices and browsers to ensure cross-platform compatibility, especially for WebGL support.
- Validate GeoJSON data for correct structure and coordinate systems using online validators like geojsonlint.com.
- Log data transformations and coordinate conversions to verify accuracy and identify calculation errors.
- Simulate network conditions using browser throttling tools to test offline and low-bandwidth scenarios.
- Check for memory leaks by monitoring the number of Three.js objects created and destroyed over time.
Deployment and Hosting Options
Deploy your serverless 3D globe visualization using static hosting platforms like Vercel, Netlify, GitHub Pages, or Cloudflare Pages. These platforms support automatic deployments from Git repositories and provide global CDN for fast content delivery. Since the entire application runs client-side, no backend configuration is required. Configure custom domains, SSL certificates, and caching policies to optimize performance and security. Ensure CORS policies are set appropriately if fetching data from external APIs.
Conclusion and Future Trends
Serverless 3D globe visualizations represent a paradigm shift in how we interact with real-time geospatial data. By leveraging client-side technologies, developers can create immersive, responsive, and cost-effective visualizations that empower users to explore data dynamically. As WebAssembly and WebGPU mature, expect even more sophisticated and performant 3D visualizations. Integrating machine learning for predictive analytics or augmented reality for immersive exploration could further enhance these tools. The future of data visualization lies in democratizing access to complex datasets through intuitive, interactive interfaces—enabling anyone to derive insights from real-time streams without needing a server.
Keywords:
3D visualization, real-time data, serverless applications, GeoJSON, interactive maps, WebGL, client-side rendering, data mapping, USGS earthquake data, JavaScript visualization, Three.js, D3.js, offline caching, data streaming, spatial data analysis,