Category: Web Development
Tags:Next.js, performance optimization, web development, Chrome DevTools, LCP, TBT, CLS, hydration, render-blocking, SEO optimization, frontend performance, Next.js analytics, Core Web Vitals, JavaScript optimization, asset compression,
Next.js has revolutionized modern web development by offering server-side rendering, static site generation, and hybrid rendering out of the box. However, while it simplifies many aspects of building fast and SEO-friendly applications, it can also introduce performance bottlenecks that are not immediately obvious. Poorly optimized images, unoptimized JavaScript bundles, render-blocking resources, and inefficient hydration can silently degrade your application’s speed, frustrating users and hurting your Core Web Vitals scores. The good news is that with the right tools and techniques, you can identify and fix these issues efficiently—without resorting to trial and error or over-engineering solutions.
#Nextjs #WebDevelopment #PerformanceOptimization #Frontend #SoftwareEngineering #Softved
Why Performance Matters in Next.js Applications
In today’s digital landscape, performance is not just a technical concern—it directly impacts user engagement, conversion rates, and search engine rankings. Google’s Core Web Vitals, which include Largest Contentful Paint (LCP), Total Blocking Time (TBT), and Cumulative Layout Shift (CLS), have become critical ranking factors. A slow Next.js app can lead to higher bounce rates, lower time-on-site, and ultimately, reduced revenue. Performance issues often stem from client-side JavaScript bloat, unoptimized static assets, or inefficient data fetching strategies. Addressing these bottlenecks is essential for delivering a smooth, responsive, and competitive user experience.
Step 1: Diagnose Performance Issues Using Chrome DevTools
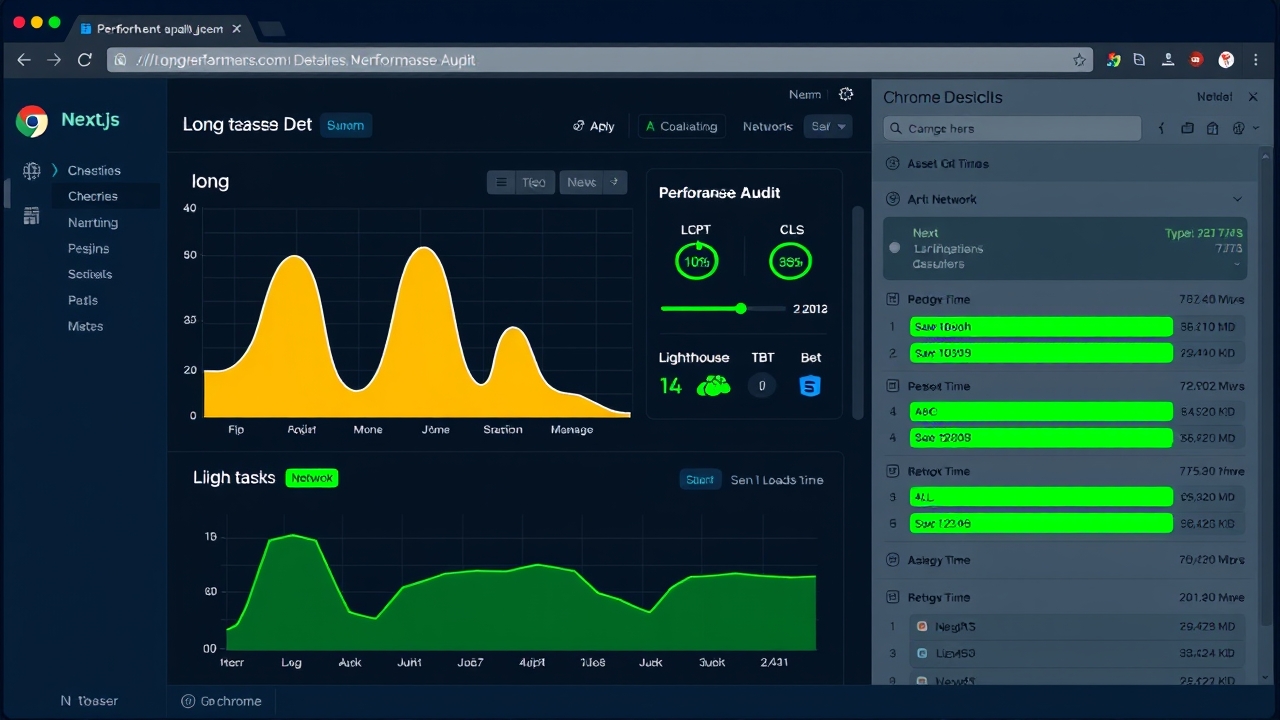
Chrome DevTools is your first line of defense when diagnosing Next.js performance problems. The Performance, Lighthouse, and Network panels provide deep insights into how your application loads and renders. Start with the Performance panel to record a load or user interaction, then analyze the flame chart to identify long tasks, excessive JavaScript execution, or layout thrashing. The Lighthouse panel, accessible via DevTools, generates an automated report highlighting opportunities to improve performance, accessibility, and SEO. Pay special attention to warnings about render-blocking resources, unused JavaScript, or large resource sizes. The Network panel lets you inspect how quickly assets load, helping you pinpoint slow image requests or large JavaScript files.
- Open Chrome DevTools (F12 or Ctrl+Shift+I) and navigate to the Performance tab to record page load times and identify JavaScript execution bottlenecks.
- Use the Lighthouse tab to generate a full performance audit, focusing on metrics like LCP, TBT, and CLS scores.
- Inspect the Network tab to analyze asset load times, identify slow API calls, and detect oversized images or scripts.
- Enable the “Coverage” tab to see which JavaScript and CSS code is unused or partially used, and remove or optimize it accordingly.
Step 2: Leverage Next.js Built-in Analytics for Data-Driven Insights
Next.js provides built-in analytics through the `next build` and `next start` commands, which generate a performance report highlighting key metrics like page load times, static generation duration, and client-side bundle sizes. Additionally, using the `next.config.js` file, you can enable the built-in profiler by adding `webpack: true` in the config. This profiler outputs detailed information about your application’s bundle, including module sizes and dependencies. For more advanced insights, integrate tools like Sentry or Vercel Analytics to monitor real user performance (RUM) and track how changes affect user experience over time.
- Run `next build` and check the performance report to identify slow pages and large bundles.
- Enable the Next.js profiler in `next.config.js` to analyze module-level performance and dependencies.
- Integrate Vercel Analytics or Sentry to monitor real user metrics and track performance trends.
- Use the `next/analytics` package to collect and analyze client-side performance data without third-party services.
Step 3: Identify and Fix Oversized Assets and Render-Blocking Scripts
Large assets like images, fonts, and JavaScript bundles are common culprits behind slow Next.js applications. Images often account for the majority of a page’s weight, so optimizing them is critical. Use modern formats like WebP or AVIF, implement lazy loading, and set appropriate `width` and `height` attributes to prevent layout shifts. For JavaScript, defer non-critical scripts using the `defer` or `async` attributes, and split your bundles using code splitting techniques such as dynamic imports (`import()`). Additionally, minify and compress your assets using tools like Terser or esbuild, and leverage HTTP/2 or HTTP/3 for faster parallel loading.
- Convert images to WebP or AVIF and implement lazy loading with `loading=”lazy”` to reduce initial load size.
- Use dynamic imports (`import()`) to split large JavaScript bundles and load them only when needed.
- Minify and compress JavaScript and CSS using Terser, esbuild, or Next.js’s built-in minification in `next.config.js`.
- Defer or asynchronously load non-critical scripts and third-party libraries to prevent render-blocking.
- Enable Brotli compression on your server to reduce asset sizes by up to 30% compared to Gzip.
Step 4: Optimize Hydration and Client-Side Rendering
Hydration in Next.js ensures that server-rendered pages are interactive by attaching event handlers and state to the DOM. However, inefficient hydration can lead to excessive JavaScript execution, delayed interactivity, and poor TBT scores. To optimize hydration, avoid sending unnecessary JavaScript by using dynamic imports for client-side components and keeping the initial bundle size small. Use React’s `React.lazy` and `Suspense` to lazy-load components, and consider server-side rendering (SSR) or static generation (SSG) for critical paths to reduce client-side work. Additionally, avoid large JSON payloads from API routes by implementing pagination or selective data fetching.
- Use React.lazy and Suspense to lazy-load components and reduce initial JavaScript payload.
- Minimize client-side state management by leveraging server-side rendering for critical pages.
- Avoid sending large JSON responses from API routes; implement pagination or selective data fetching instead.
- Use Next.js’s `getStaticProps` or `getServerSideProps` to pre-render pages and reduce client-side hydration work.
- Monitor hydration performance using the React DevTools profiler to identify slow component renders.
Step 5: Improve Data Fetching and Caching Strategies
Inefficient data fetching can significantly slow down Next.js applications, especially when dealing with client-side data loading or unoptimized API calls. Next.js supports multiple data fetching methods, including `getStaticProps`, `getServerSideProps`, and client-side fetching with SWR or React Query. Use `getStaticProps` for static data to enable pre-rendering and caching, while reserving `getServerSideProps` for dynamic content that requires real-time data. For client-side fetching, implement caching strategies like SWR’s `revalidate` or React Query’s `stale-while-revalidate` to minimize redundant API calls. Additionally, use edge functions or middleware to cache responses at the CDN level and reduce latency for global users.
- Use `getStaticProps` for static data to pre-render pages and enable caching with ISR (Incremental Static Regeneration).
- Leverage SWR or React Query for client-side data fetching with built-in caching and revalidation.
- Implement caching headers (e.g., `Cache-Control: max-age=3600`) for API responses to reduce redundant requests.
- Use Next.js middleware or edge functions to cache responses at the CDN level for global users.
- Avoid over-fetching by implementing selective data fetching and pagination for large datasets.
Step 6: Monitor and Maintain Long-Term Performance
Performance optimization is not a one-time task—it requires continuous monitoring and iteration. Set up automated performance testing using tools like Lighthouse CI, WebPageTest, or Calibre to track changes over time and catch regressions early. Integrate performance budgets into your CI/CD pipeline to enforce asset size limits and alert developers when thresholds are exceeded. Regularly audit third-party scripts and libraries for updates that may introduce performance regressions. Finally, use real user monitoring (RUM) tools to gather insights into how actual users experience your application and prioritize fixes based on real-world impact.
- Set up Lighthouse CI or WebPageTest to automate performance audits and detect regressions in your CI/CD pipeline.
- Establish performance budgets for asset sizes and enforce them using tools like Calibre or custom scripts.
- Regularly audit third-party scripts and libraries for updates and performance improvements.
- Use real user monitoring (RUM) tools like Sentry or Vercel Analytics to track performance trends and user impact.
- Schedule monthly performance reviews to reassess bottlenecks, test new optimizations, and prioritize fixes based on data.
Actionable Checklist for Next.js Performance Optimization
To ensure you don’t miss any critical steps, follow this actionable checklist to optimize your Next.js application’s performance systematically. Start with a baseline audit using Lighthouse, then move through each category—asset optimization, hydration, data fetching, and caching—applying fixes incrementally. Test each change using Chrome DevTools or WebPageTest to measure its impact on Core Web Vitals. Finally, set up ongoing monitoring to maintain optimal performance as your application evolves.
- Run a Lighthouse audit to establish a performance baseline for your Next.js app.
- Optimize images by converting to modern formats, implementing lazy loading, and setting appropriate dimensions.
- Minify and compress JavaScript and CSS assets using tools like Terser or esbuild.
- Defer non-critical scripts and use dynamic imports to reduce initial bundle sizes.
- Implement lazy loading for components using React.lazy and Suspense.
- Use `getStaticProps` for static data and SWR/React Query for client-side caching.
- Enable HTTP/2 or HTTP/3 for faster parallel asset loading and reduce latency.
- Set up automated performance testing in your CI/CD pipeline to catch regressions early.
- Monitor real user performance with tools like Sentry or Vercel Analytics.
- Schedule regular performance reviews to reassess bottlenecks and test new optimizations.