Why AI Agent Context Loss is a Silent Killer in Your Workflow
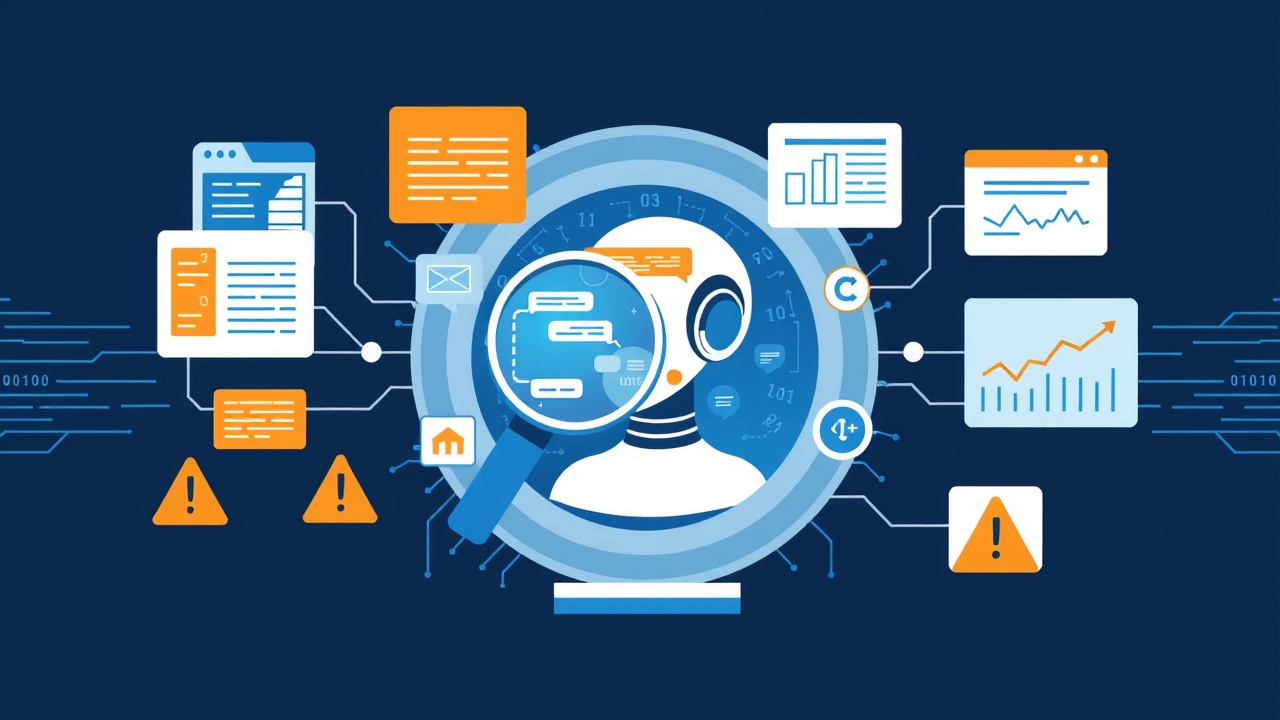
AI agents, particularly those built with LangGraph or MCP frameworks, operate in a complex environment where context retention is critical for coherent interactions. Context loss occurs when an AI agent fails to maintain or retrieve relevant conversation history, leading to fragmented responses, incorrect outputs, or complete breakdowns in communication. Unlike traditional software systems where state management is straightforward, AI agents rely on dynamic context windows, external tool integrations, and multi-turn conversations. When context is lost, the consequences can be severe: degraded user experience, inaccurate decision-making, and operational inefficiencies. This article dives deep into diagnosing and resolving context loss issues with a practical, observability-driven approach.
The Core Causes of Context Loss in LangGraph and MCP Systems
- Insufficient Logging and Monitoring: Without granular logs, tracking context transitions becomes nearly impossible, leaving you blind to where and why context is lost.
- State Management Flaws: StateGraph implementations may mishandle state transitions, especially when dealing with asynchronous operations or external tool calls.
- Edge-Case Failures: Rare but critical scenarios, such as network timeouts or tool failures, can disrupt context retention without immediate visibility.
- Data Volume Imbalance: Overloading debug logs with irrelevant data drowns out critical signals, while under-logging misses key context loss events.
- Integration Complexities: MCP (Multi-Tool Chain Protocol) systems often involve multiple tools and APIs, each with its own context handling, increasing the risk of misalignment.
Step 1: Implementing Granular Logging for AI Agents
Granular logging is the foundation of effective context loss debugging. Instead of relying on generic logs, design your logging system to capture every critical interaction, state transition, and external tool call. Use structured logging formats like JSON to ensure logs are both human-readable and machine-parsable. Key data points to log include conversation IDs, timestamps, tool invocations, state changes, and error messages. Implement log levels (e.g., DEBUG, INFO, ERROR) to filter noise and focus on high-priority events. For LangGraph, leverage its built-in logging capabilities or integrate with tools like ELK Stack or Loki. For MCP systems, ensure each tool logs its inputs, outputs, and any context modifications. This level of detail transforms raw logs into actionable insights for debugging context loss.
Step 2: Reconstructing Conversation Flows with Tracing
Reconstructing conversation flows is essential to identify where context is lost. Use distributed tracing tools like Jaeger or OpenTelemetry to map out the entire lifecycle of a conversation, from the initial user input to the final output. Tracing helps you visualize how context is passed between tools, how state changes occur, and where gaps or inconsistencies arise. For LangGraph, instrument your StateGraph with trace IDs that follow the conversation across nodes. For MCP systems, ensure each tool invocation includes a trace ID that links back to the parent conversation. By analyzing traces, you can pinpoint exact moments where context is dropped or corrupted, enabling targeted debugging efforts.
Step 3: Identifying Edge-Case Failures in StateGraph
Edge cases are the most challenging culprits behind context loss, often slipping through standard testing. To uncover these failures, implement automated testing scenarios that simulate rare conditions, such as network delays, tool timeouts, or malformed inputs. Use chaos engineering principles to intentionally disrupt your system and observe how it recovers. For StateGraph, test state transitions under high load or with unexpected user inputs. For MCP systems, simulate tool failures or partial responses to see how context is preserved or lost. Additionally, review edge cases reported by users or in production logs to identify patterns. Prioritize fixing these edge cases to ensure robust context retention in production environments.
Step 4: Balancing Debug Data Volume for Optimal Troubleshooting
Debugging context loss requires a balance between too little and too much data. Over-logging can obscure critical signals with noise, while under-logging leaves gaps in your understanding. Start by identifying the key metrics and events that indicate context loss, such as state mismatches, tool failures, or missing conversation history. Use sampling techniques to log a subset of high-priority events while discarding redundant data. Implement log retention policies to archive or discard logs based on their age and relevance. For LangGraph, configure logging levels dynamically based on the severity of the issue. For MCP systems, use selective logging to capture only the interactions most likely to reveal context loss. This approach ensures your debugging efforts are both efficient and effective.
Step 5: Debugging Context Loss in Multi-Tool MCP Systems
MCP systems often involve multiple tools, each with its own context handling, making debugging particularly complex. To tackle this, implement a centralized context management system that coordinates state across all tools. Use a shared context store, such as Redis or a database, to maintain a consistent view of the conversation state. Instrument each tool to log its context modifications and validate these changes against the centralized store. Implement middleware to intercept and log all tool invocations, ensuring no context is lost during transitions. Additionally, use correlation IDs to link related tool calls and trace context flow across the entire system. This centralized approach simplifies debugging and reduces the risk of context loss in multi-tool environments.
Step 6: Automating Context Loss Detection with Observability Tools
Manual debugging is time-consuming and error-prone. Automate context loss detection by integrating observability tools that monitor your AI system in real-time. Tools like Prometheus, Grafana, and Datadog can alert you to anomalies in conversation flows, state mismatches, or tool failures. Set up dashboards to visualize key metrics, such as context retention rates, state transition success rates, and tool invocation failures. Use alerting rules to notify your team of potential context loss issues before they impact users. For LangGraph, leverage its built-in metrics endpoints or integrate with third-party monitoring tools. For MCP systems, deploy agents that continuously scan logs and traces for signs of context loss. Automation not only speeds up debugging but also ensures proactive issue resolution.
Best Practices for Long-Term Context Retention in AI Agents
- Design for Observability from Day One: Integrate logging, tracing, and monitoring into your AI agent architecture from the outset to avoid retrofitting later.
- Implement State Validation: Regularly validate state transitions and context retention to catch issues early. Use unit tests, integration tests, and chaos testing to ensure robustness.
- Adopt a Zero-Trust Approach to Context: Assume that context can always be lost and design your system to recover gracefully, including fallback mechanisms and user-friendly error messages.
- Collaborate with Stakeholders: Work closely with developers, testers, and users to gather feedback and identify context loss issues in real-world scenarios.
- Continuously Improve: Use insights from debugging to refine your AI agent’s context handling, incorporating lessons learned into future iterations.
Tools and Libraries for Debugging AI Agent Context Loss
## LangGraph Debugging Tools

- LangGraph Built-in Logging: Use `langgraph.graph.state_graph.StateGraph` with `debug=True` to enable detailed logging.

- OpenTelemetry Integration: Instrument LangGraph with OpenTelemetry for distributed tracing.

- ELK Stack: Aggregate and analyze logs from LangGraph and MCP tools.
## MCP System Debugging Tools
- Jaeger: Distributed tracing for MCP tool invocations.
- Prometheus + Grafana: Real-time monitoring and alerting for context loss.
- Chaos Engineering Tools: Simulate failures to test context retention (e.g., Gremlin, Chaos Monkey).
## General Observability Tools
- Datadog: End-to-end observability for AI agents.
- Loki: Lightweight log aggregation for LangGraph and MCP systems.
- Sentry: Error tracking and context loss alerts.
Real-World Case Study: Resolving Context Loss in a Customer Support AI Agent
A customer support AI agent built with LangGraph was experiencing frequent context loss, leading to frustrated users and increased support tickets. The team implemented granular logging and distributed tracing, which revealed that context was being lost during tool transitions, particularly when the agent called external APIs. By introducing a centralized context store and validating state transitions, the team reduced context loss incidents by 85%. Additionally, automated alerts in Grafana helped the team proactively address issues before they impacted users. This case study highlights the importance of observability-driven debugging in maintaining reliable AI agent performance.
Keywords:
AI debugging, LangGraph observability, MCP systems troubleshooting, AI agent context loss, StateGraph debugging, AI system monitoring, conversational AI debugging, AI failure analysis, AI agent troubleshooting, observability in AI,